
Adult Inpatient Services
Service users discharged between January and December 2016 from adult inpatient services were given the opportunity to return the satisfaction survey prior to discharge, by post following discharge or to complete the survey online. 2986 discharges were processed in 2016, with a total of 410 (13.7%) surveys being returned to St Patrick’s Adult Inpatient services. The response rate relates to the number of discharges, rather than the number of people discharged. When the number of individual people discharged (1909) is considered then the response rate increases to 21.5%. SPMHS is actively working on methods to improve response rates for 2017.
Table: Number of adult inpatient surveys returned and discharges in 2016
| Month | Surveys Returned | Discharges |
| January | 35 | 248 |
| February | 1 | 218 |
| March | 44 | 253 |
| April | 52 | 245 |
| May | 43 | 265 |
| June | 33 | 239 |
| July | 33 | 280 |
| August | 52 | 258 |
| September | 30 | 279 |
| October | 38 | 238 |
| November | 32 | 249 |
| December | 17 | 214 |
| Total | 410 | 2986 |
Service User Responses
“Can you recall how long you waited for an admission to hospital?”
The most common waiting time frames reported by respondents were between ‘4-7 days’ (24.1%), and between ‘1-3 days’ (23.9%), (see table below). 21.7% waited <1 day.
Table: Percentage of respondents who endorsed each first appointment waiting time frame
| Waiting Time | n | % |
| <1 day | 89 | 21.7 |
| 1-3 days | 98 | 23.9 |
| 4-7 days | 99 | 24.1 |
| 1-2 weeks | 57 | 13.9 |
| 3-4 weeks | 37 | 9.0 |
| Don't know | 20 | 5.0 |
| No answer | 10 | 2.4 |
| Total | 410 | 100.0 |
“When you came to the hospital for assessment/admission how long did you have to wait before you were seen by a member of staff?”
The most common waiting time frame reported by respondents was less than 1 hour, with 63.9% of respondents reporting this time period (see table below).
Table: How long respondents waited to be seen by staff at admission.
| Waiting Time | n | % |
| <1 hr | 262 | 63.9 |
| 1-2 hrs | 82 | 20.0 |
| 3-4 hrs | 23 | 5.6 |
| 3-4 hrs | 8 | 2.0 |
| >4 hrs | 14 | 3.4 |
| Don't know | 9 | 2.2 |
| No answer | 12 | 2.9 |
| Total | 410 | 100.0 |
“Please tell us how long it took from your arrival in admissions to your arrival on the ward?”
The most common waiting time frames reported by respondents were ‘1-2 hrs’ (31.7%) and ‘’2-3 hrs’ (23.7%) (see table below).
Table: How long respondents waited to arrive on ward at admission
| Waiting Time | n | % |
| <1 hr | 80 | 19.5 |
| 1-2 hrs | 130 | 31.7 |
| 2-3 hrs | 97 | 23.7 |
| 3-4 hrs | 50 | 12.2 |
| >4 hrs | 33 | 8.0 |
| Don't know | 13 | 3.2 |
| No answer | 7 | 1.7 |
| Total | 410 | 100.0 |
“Tell us about your experience of admission.”
Table: Respondents’ opinions regarding their experience of admission to Hospital
| Tell us about your experience of admission. | Yes | No | Don't Know | No Answer | ||||
| n | % | n | % | n | % | n | % | |
| When you came to the Hospital did a member of the assessment unit greet you? | 308 | 75.1 | 54 | 13.2 | 36 | 8.8 | 12 | 2.9 |
| When you came to the Hospital did a member of the assessment team explain clearly what would be happening? | 287 | 70.0 | 61 | 14.9 | 40 | 9.8 | 22 | 5.3 |
| When you arrived on the ward, or soon afterwards, did a member of staff tell you about the daily routine on the ward? | 308 | 75.1 | 64 | 15.6 | 26 | 6.3 | 12 | 2.9 |
| Were you given written information about the Hospital and the services provided? | 286 | 69.8 | 90 | 22.0 | 20 | 4.9 | 14 | 3.3 |
“In relation to your care plan, can you tell us the following…”
| In relation to your care plan… | Agree | Neither | Disagree | Don't know | No answer | |||||
| n | % | n | % | n | % | n | % | n | % | |
| I understand what a care plan is | 329 | 80.2 | 31 | 7.6 | 14 | 3.4 | 12 | 2.9 | 24 | 5.9 |
| I was involved in the development of my care plan | 237 | 57.8 | 60 | 14.6 | 64 | 15.6 | 20 | 4.9 | 29 | 7.1 |
| I was offered a copy of my care plan | 177 | 43.2 | 28 | 6.8 | 136 | 33.2 | 26 | 6.3 | 43 | 10.5 |
| I was involved in the review of my care plan | 208 | 50.7 | 59 | 14.4 | 82 | 20.0 | 20 | 4.9 | 41 | 10.0 |
| There was a focus on recovery in the care and treatment offered | 315 | 76.8 | 37 | 9.0 | 22 | 5.4 | 6 | 1.5 | 30 | 7.3 |
| My care plan is key to my recovery | 256 | 62.4 | 72 | 17.6 | 40 | 9.8 | 8 | 2.0 | 34 | 8.3 |
Service users’ perceptions regarding their understanding, involvement and engagement in their care plan has been a significant focus for the organisation over recent years. The concept of a care plan isn’t familiar for many service users, particularly those being admitted for the first time. There has been on-going work at multidisciplinary team level to inform service users and facilitate their involvement and engagement in their care planning process. Education and information regarding care planning, key working, recovery focus and multidisciplinary teams has also been on-going on an organisational level through a regular morning lecture and information booklets provided to all service users’ on inpatient admission. This on-going focus has produced positive results, for example, as can be seen above 80.2% reported that they understood what a care plan is and 57.8% reported that they were involved in the development of their care plan.
“During my stay in hospital I was given enough time with the following health professionals…”
| Agree | Neither | Disagree | Don't know | No answer | ||||||
| n | % | n | % | n | % | n | % | n | % | |
| Consultant Psychiatrist | 301 | 73.4 | 26 | 6.3 | 50 | 12.2 | 2 | 0.5 | 31 | 7.6 |
| Registrar | 254 | 62.0 | 49 | 12.0 | 50 | 12.2 | 9 | 2.2 | 48 | 11.7 |
| Key Worker | 205 | 50.0 | 46 | 11.2 | 90 | 22.0 | 16 | 3.9 | 53 | 12.9 |
| Nursing Staff | 330 | 80.5 | 16 | 3.9 | 26 | 6.3 | 2 | 0.5 | 36 | 8.8 |
| Psychologist | 137 | 33.4 | 34 | 8.3 | 92 | 22.4 | 29 | 7.1 | 118 | 28.7 |
| Occupational Therapist | 157 | 38.3 | 47 | 11.5 | 78 | 19.0 | 29 | 7.1 | 99 | 24.1 |
| Social Worker | 136 | 33.2 | 57 | 13.9 | 59 | 14.4 | 39 | 9.5 | 119 | 29.0 |
| Pharmacist | 139 | 33.9 | 53 | 12.9 | 59 | 14.4 | 38 | 9.3 | 121 | 29.5 |
| Other | 108 | 26.3 | 31 | 7.6 | 39 | 9.5 | 36 | 8.8 | 196 | 47.7 |
If you were referred to a therapeutic programme, how long did you wait to attend the programme?
| Waiting Time | n | % |
| <1 week | 68 | 16.6 |
| 1-2 weeks | 52 | 12.7 |
| 2-3 weeks | 28 | 6.8 |
| >3 weeks | 70 | 17.1 |
| Not on programme | 68 | 16.6 |
| No Answer | 124 | 30.2 |
| Total | 410 | 100.0 |
Just under a third of people (29.3%) waited up to two weeks to attend a programme.
Tell us about your care…
Table: Respondents’ experiences of the team during their in-patient stay
| Experience of the team that worked with you | Strongly Agree | Agree | Disagree | Strongly Disagree | No answer | |||||
| n | % | n | % | n | % | n | % | n | % | |
| Trusted the team members | 252 | 61.5 | 90 | 22.0 | 21 | 5.1 | 4 | 1.0 | 43 | 10.5 |
| Treated with dignity and respect | 261 | 63.7 | 86 | 21.0 | 20 | 4.9 | 6 | 1.5 | 37 | 9.0 |
| Protected my confidentiality | 267 | 65.1 | 81 | 19.8 | 14 | 3.4 | 4 | 1.0 | 44 | 10.7 |
| Respected my privacy | 264 | 64.4 | 80 | 19.5 | 18 | 4.4 | 7 | 1.7 | 41 | 10.0 |
| Were courteous | 270 | 65.9 | 81 | 19.8 | 10 | 2.4 | 5 | 1.2 | 44 | 10.7 |
| Felt included when my team discussed medical issues at my beside / in my room | 241 | 58.8 | 87 | 21.2 | 19 | 3.7 | 9 | 2.2 | 54 | 13.2 |
| Respected me as an individual | 261 | 63.7 | 86 | 21.0 | 15 | 3.7 | 7 | 1.7 | 41 | 10.0 |
Tell us about your experience of discharge…
Table: Respondents’ perceived involvement in discharge
| Experience of Discharge from Hospital | Yes | No | Don't Know | No Answer | ||||
| n | % | n | % | n | % | n | % | |
| Did you discuss and agree your discharge with your treating team? | 333 | 81.2 | 28 | 6.8 | 8 | 2.0 | 41 | 9.9 |
| Do you think you were given enough notice of your discharge from hospital? | 338 | 82.4 | 31 | 7.6 | 6 | 1.5 | 35 | 8.5 |
| Do you have a discharge plan? | 282 | 68.8 | 69 | 16.8 | 15 | 3.7 | 44 | 10.7 |
| Do you know what to do in the event of a further mental health crisis? | 297 | 72.4 | 53 | 12.9 | 15 | 3.7 | 45 | 11 |
Tell us about your experience of hospital activities…
| Tell us about your experience of hospital activities | Yes | No | Don't Know | No Answer | ||||
| n | % | n | % | n | % | n | % | |
| Did you attend any of the activities during the day? | 348 | 84.9 | 47 | 11.5 | 1 | 0.2 | 14 | 3.4 |
| Did you attend any of the activities in the evenings and at weekends? | 268 | 65.4 | 119 | 29.0 | 3 | 0.7 | 20 | 4.9 |
| Was there a range of activities that you could get involved in? | 344 | 83.9 | 45 | 11 | 6 | 1.5 | 15 | 3.7 |
| At the weekend were there enough activities available for you? | 159 | 38.8 | 181 | 44.1 | 30 | 7.3 | 40 | 9.6 |
The majority of respondents felt that there was a range of activities they could get involved in (83.9%). However, 44.1% indicated that there were not enough activities available in the hospital at weekends.
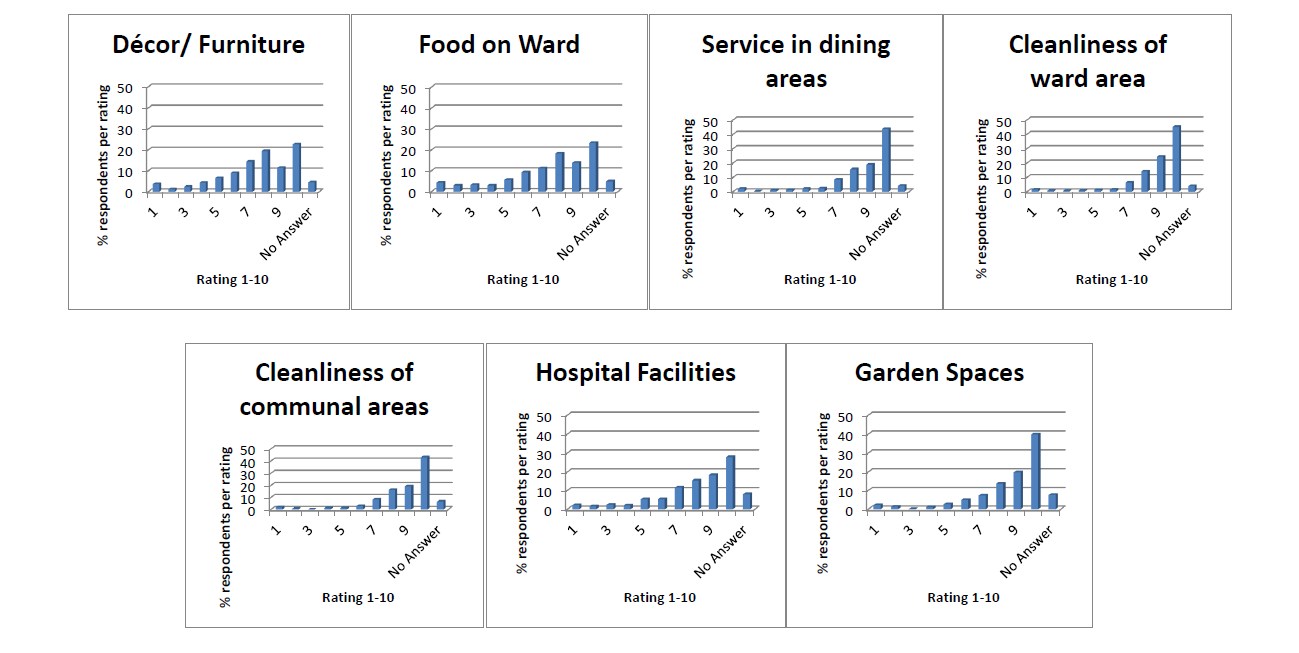
Tell us about your experience of hospital facilities…
A series of questions asked respondents to rate Hospital facilities on a scale of 1 (poor) to 10 (excellent). Further examination of the mean and standard deviation suggests that respondents held highly positive opinions of the Hospital facilities, with all means above 7. In particular, the cleanliness of the ward (8.9) and Communal areas (8.8) received high scores as well. The standard deviation across most areas was close to 2 indicating that there was significant variation in responses.
Table: Respondents’ scores of Hospital facilities
| Rate the following in relation to the Hospital… | N | Mean (μ) | Standard Deviation (∂) |
| Décor/Furniture | 391 | 7.3 | (∂) |
| Food on Ward | 390 | 7.4 | 2.4 |
| Service in ward dining areas | 393 | 8.9 | 2.5 |
| Cleanliness of ward areas | 394 | 8.9 | 1.7 |
| Cleanliness of Communal areas | 383 | 8.8 | 1.7 |
| Hospital Facilities | 377 | 7.9 | 2.2 |
| Garden Spaces | 379 | 8.5 | 2.0 |
Tell us about your experience of stigma following your experience in hospital…
Respondents were asked to reflect on their opinions towards mental health difficulties and whether they would disclose to others that they received support from St Patrick’s. The majority of respondents felt they had more positive views towards mental health difficulties in general (80%) and towards their own mental health difficulties (78.5%) and felt that they would share with others that they received support from St Patrick’s (67.6%).
Table: Experiences of stigma
| Tell us about your views and perceptions regarding mental illness following your stay… | Yes | No | Don't Know | No Answer | ||||
| n | % | n | % | n | % | n | % | |
| Are your views regarding mental illness in general more positive than they were? | 328 | 80.0 | 38 | 9.3 | 18 | 4.4 | 26 | 6.3 |
| Are your views regarding your own mental illness more positive than they were? | 322 | 78.5 | 47 | 11.5 | 16 | 3.9 | 25 | 6.1 |
| Will you tell people that you have stayed in St Patrick's? | 277 | 67.6 | 59 | 14.4 | 43 | 10.5 | 31 | 7.5 |
Overall views of St Patrick’s Mental Health Services
Service users who completed and returned the Service User Satisfaction Survey demonstrated a high level of satisfaction with the care they received, rating their care and treatment in Hospital on a scale of 1 to 10, with a mean of 8.5 (N=391; SD=2.0). Respondents also demonstrated a high level of satisfaction with the Hospital overall, rating the Hospital on a scale of 1 to 10, with a mean of 8.7 (N=392; SD=1.7).
Table: Respondents’ ratings of care and treatment and overall experience of Hospital
| How would you rate…? | …your care & treatment | …the Hospital overall | ||
| n | % | n | % | |
| 1 | 8 | 2.0 | 6 | 1.5 |
| 2 | 2 | 0.5 | 1 | 0.2 |
| 3 | 4 | 1 | 1 | 0.2 |
| 4 | 7 | 1.7 | 3 | 0.7 |
| 5 | 9 | 2.2 | 10 | 2.4 |
| 6 | 18 | 4.4 | 12 | 2.9 |
| 7 | 29 | 7.1 | 31 | 7.6 |
| 8 | 68 | 16.6 | 75 | 18.3 |
| 9 | 79 | 19.3 | 90 | 22.0 |
| 10 | 167 | 40.7 | 163 | 39.8 |
| No Answer | 19 | 4.5 | 18 | 4.4 |
| 1-5 | 30 | 7.4 | 21 | 5 |
| 6-10 | 361 | 88.1 | 371 | 90.6 |
| Total | 399 | 100.0 | 399 | 100.0 |
Table: Respondents’ ratings of care and treatment and overall experience of Hospital
| How would you rate…? | N | Mean (μ) | Standard Deviation (∂) |
| Your care and treatment in Hospital | 391 | 8.5 | 2.0 |
| The Hospital | 392 | 8.7 | 1.7 |
Further Service User Views
Inpatient respondents were invited to answer three open-ended qualitative questions in order to identify any points of interest not contained within the closed statements, and to give further voice to the service users’ experiences. Not all respondents answered these questions. Please find below a sample of answers:
Q: Is there anything else you would like to tell us about your experiences of being in Hospital please do so here.
Positive Comments include:
- “ All staff very aproachable and understanding. I love the idea of a key worker and openness of service users being involved in care plan.”
- “Meeting with my psychologist X really helped me progress in my recovery. She helped me get through many difficult times. Dean Swift ward was the best in hospital. I felt very secure there.”
- “Staff are super, nursing staff couldn’t be more helpful or better, they are professionalism personified. I won’t name names but there are a couple or so that stand out, even amongst general excellence, the only criticism that I would have is that weekends can be very long for people who can’t go out or have nowhere to go.”
- “Activities and food have improved a lot since I was in 2003.”
- “Staff were professional, caring and always helpful. Regarding food, I liked the variety on offer, particularly the fruit.”
- “I am so grateful- you saved my life.”
- “I felt comfortable because the nursing staff made me feel I would get better and I felt safe.”
Comments to learn from include:
- “I think an ATM would be beneficial. Tea/coffee machines also.”
- “More weekend activities would really help. Extended hours of art, pottery & craft would alleviate boredom & help recovery.”
- “Renovation done on the ward were necessary but quite disturbing. Would be better to move patients for a few days. Very hard to rest during the day with drilling, banging etc.”
- “The two toilets to serve the bay area were filthy at times (showers outdated).”
- “The yoga and pilates programme did not take any account of the patients. It was just a series of exercises, going through the motions, no music, no interest, no way tailoring the sessions to cater for its participants.”
Q: Was there anything particularly good about your care?
- “Can’t say enough about how good and caring the staff here are. That includes the cleaning staff and the catering staff.”
- “Respect, efficiency, understanding, non-judgemental, encouraging.”
- “My care was excellent at all times. I recovered slowly and was given all the time I needed to get well. The kitchen staff were excellent, attentive, kind.”
- “Having a private room essential for my recovery. Some of the nurses on the ward were very helpful as well. To have a medical team including psychiatrist, psychologist, social worker as well as occupational therapist allowed me to cover all the issues that needed to be addressed.”
- “Plenty to do during the day. Daily activities and twilight was very beneficial
- “Knowing there was a team of experts at your dispense. The morning lectures and information centre are excellent.”
- “I felt included in my care and I felt comfortable discussing any issues that came up, particularly those affecting me personally.”
- “The professionalism and compassion of the staff.”
- “I felt minded, taken care of because I really needed minding. I felt safe. I was treated with great respect.”
- “The comfortable accommodation and the positive attitude of my doctor. Meals very good and breaks for snacks between meals.”
- “I felt that all involved in my care plan: nurses, doctors, counsellors catered for my specific needs and were very attentive and put a lot of work and thought into my post discharge care.”
- “I found the surroundings in the hospital warm, friendly and relaxing. This helped my body and mind to relax which contributed significantly to my recovery as did the food I received.”
- “I learned what my early warning signs are and how to keep myself well. I am still attending courses even though I am no longer and inpatient which is great as you feel it makes it easier adjusting back to your ‘normal’ life.”
- “I loved sitting out in the garden.”
Q: What could we improve?
- “The cleaning trollies on the ward should not be left in the centre of the corridor but pushed to the side it is like an obstacle course trying to walk.”
- “Proper orientation on admission. Hospital, ward, condition, each ward to have leaflets and map of hospital. Fixed bloods/ MDT/Care plan form/ consultant clinics to be displayed. Give patients max information: some will use, some won’t.”
- “There should be a service for the family members of the patient.”
- “The prices of shop should be at same level as a supermarket, too expensive. Bulletin boards are too hit and miss, timetables too individual.”
- “More activities at the weekend, the food could be better, very little variety.”
- “ It would be great if the art rooms were open at the weekend (also the library).”
- “Food. Should be able to meet psychiatrist team more than once a week.”
- “Even though everything was excellent from staff on all levels, I feel there could be some other therapeutic classes like massage, facials, relaxation therapies that would be of benefit.”
- “P.R. to the outside world, the hospital is like a school or university, hugely enlightened & at the cutting trust of mental wellness in the spirit of its founder Swift.”
- “More activities for men, very craft focused.”
- “Better communication overall. Address delays in moves to other wards. Key workers need to be aware of their role and act on it. Address failures in care plans. Feedback from complaints/ comment cards needed and expected.”
- “More activities at the weekend, an organised queuing system for meds is a must. Currently it causes some folks stress, including me.”
- “Just one thing, temple as a building, medical facility. Also: prices charged for toiletries in shop are just morally wrong.”
- “Have an area to play games maybe. The gym is great but is focused on individuals not teams.”